PHASE 02 / COUNTER SOLUTION
Custom Hardware Prototype AD8232 + MAX30102 + ESP32 Real-Time DSP · Dual-Trace GUI

DIY ECG & PPG Monitoring System

Instead of trusting noisy datasets downloaded from strangers on the internet, I built my own physical test rig to capture real electrical heart signals and optical finger pulses. This gave me complete control over what my body was doing while testing.

Heart Sensor
AD8232 (Electrical Heart Beat)
Optical Pulse
MAX30102 (Fingertip Pulse)
Processor
ESP32 (Dual-Core 240MHz)
Core Takeaway
Clean Hardware Beats Complex Code

The Problem: Noisy Datasets and Missing Context

Public research datasets are often messy: people describe their emotions inconsistently, and you have no idea if someone sneezed, shifted in their chair, or got distracted during the recording. To truly understand how heart signals respond to mental focus, I needed to build my own hardware where I knew 100% what the person was doing.

This meant stepping outside of pure software and building a physical device: connecting heart sensor boards, filtering out electrical noise, and writing fast code that detects heartbeats on a microcontroller in real time.

What was I trying to achieve?

Can affordable electronic chips (an ESP32 and low-cost sensor modules) capture clean heart signals with millisecond accuracy, so we can calculate reliable heart rate variability live on screen?

The Accuracy Challenge: Calculating accurate heart rate variability requires measuring the gap between heartbeats down to ±2 milliseconds. A single missed beat or glitch ruins the entire measurement.

Circuit Components & What They Do

Part Component What It Does
Heart Sensor Chip AD8232 Amplifier Amplifies the tiny electrical signals from the heart and filters out background static.
Electrical Filters Resistor-Capacitor Filter Blocks 50Hz electrical hum from wall outlets while letting clean heartbeats pass through.
High-Precision Converter ADS1115 (16-bit ADC) Converts delicate analog heart signals into crisp 16-bit digital numbers 860 times a second.
Microcontroller ESP32 Dual-Core The device's brain: one core reads the sensors, the other core calculates heartbeats in real time.
Electrodes Medical Sticky Gel Pads Placed on the chest to catch clean electrical pulses straight from the heart.

Step-by-Step Signal Processing

STAGE 01
High-Speed Sampling
Reads the electrical heart voltage 860 times a second and stores it smoothly without dropping a single packet.
STAGE 02
Instant Beat Detection
Runs a lightweight algorithm that catches the sharp upward spike of each heartbeat in real time.
STAGE 03
Heart Variability Math
Measures the exact millisecond gap between consecutive beats (RR interval) to track physical relaxation vs stress.
STAGE 04
Live PC Dashboard
Streams live heart waves over USB to a computer screen at 30 frames a second so you can watch your heart beat live.

Live Signal Telemetry Verification

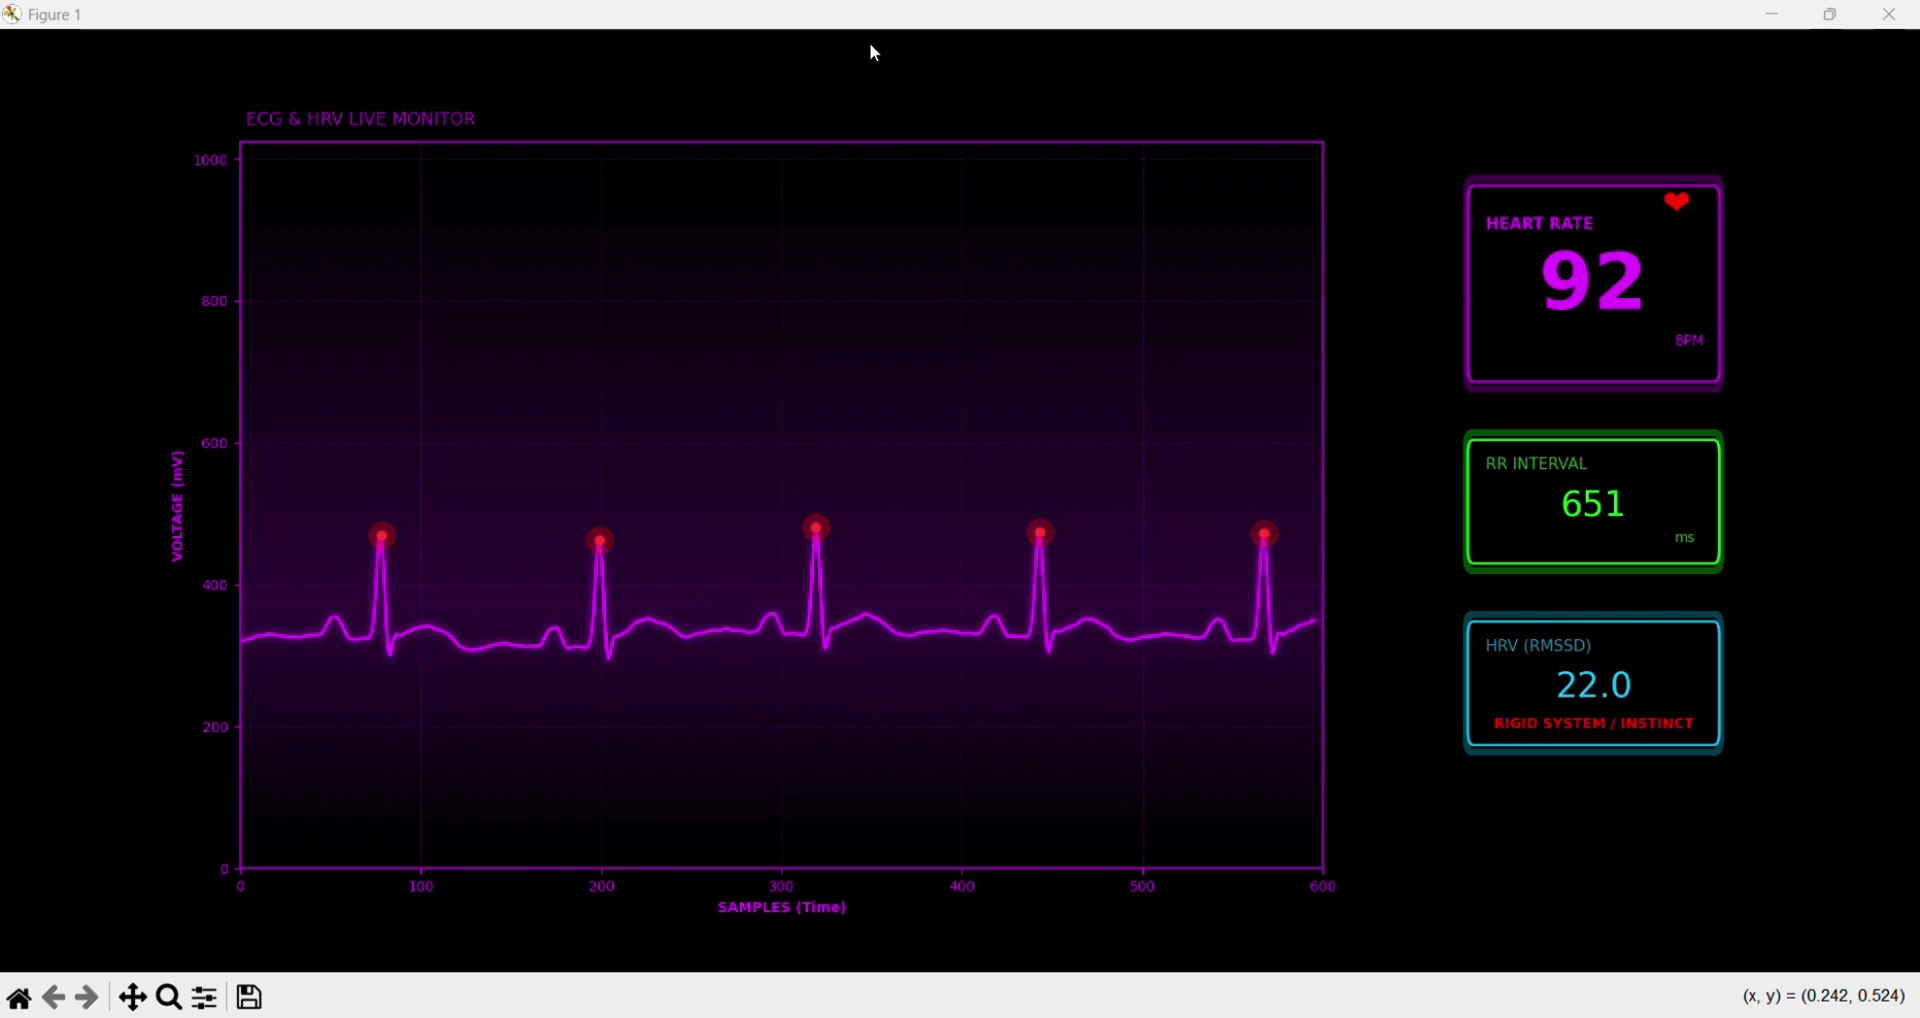
The prototype successfully achieved continuous real-time ECG telemetry. In benchmark testing during calm cognitive focus, the system demonstrated reliable R-peak tracking: 95 BPM instantaneous heart rate, 634 ms RR interval, and 25.7 ms RMSSD HRV ("Orienting / Deciding" state).
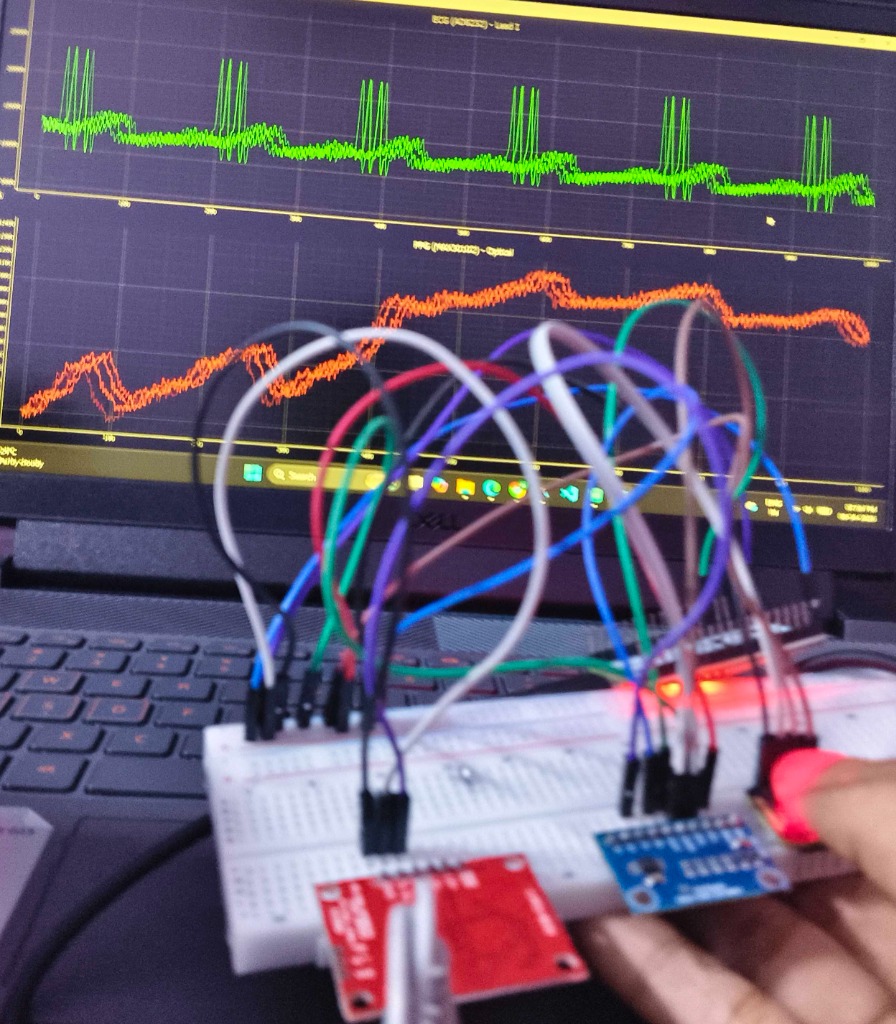
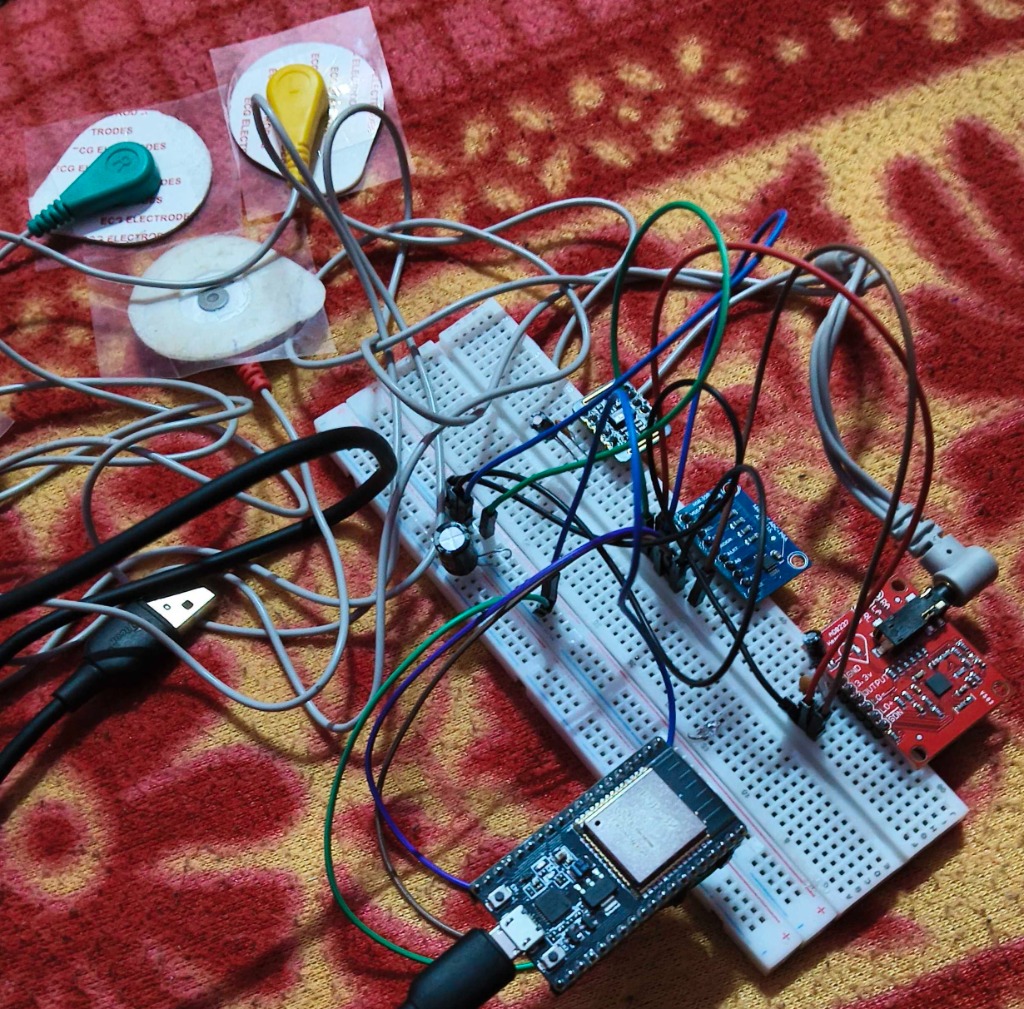
Fig. 01 · Live Synchronous Dual-Trace Telemetry (ECG + Optical PPG)
AD8232 + MAX30102 Live Link
Live Dual-Trace Oscilloscope Testing: ECG and PPG with Finger Probe
Live benchtop test in action: Finger resting on the illuminated optical aperture of the MAX30102 PPG breakout (red glow) while wet-gel electrodes stream Lead-I biopotentials. The laptop screen plots dual synchronized real-time traces: Channel 1 (top green) displays the filtered electrical ECG trace with sharp QRS complexes; Channel 2 (bottom orange) captures the synchronous vascular blood volume pulse wave (PPG), enabling pulse transit time (PTT) and arterial wave contour analysis.
Fig. 02 · Benchtop Dual-Modality Breadboard Prototype Circuit
ESP32 Hardware Rig
Hardware Rig: ESP32, AD8232 ECG board, MAX30102 PPG sensor, and electrode leads
Physical hardware architecture: Solderless prototyping assembly showing the ESP32 microcontroller (dual-core 240 MHz), the AD8232 analog front-end (red PCB) with 3.5mm jack for 3-lead snap electrodes (green, yellow, white gel pads), MAX30102 I2C optical pulse sensor (blue PCB), power rail bypass capacitors, and USB-UART streaming bridge.
Live Hardware Video Proof · Real-Time Python GUI Oscilloscope
30 FPS PyQtGraph Dashboard
Hardware & Software Proof: Screen capture of live analog ECG waveform streamed over serial from the AD8232 + ESP32 setup into the custom PyQtGraph dashboard. Displays real-time R-peak markers (red indicators), instantaneous heart rate (95 BPM), beat interval (634 ms), and real-time RMSSD (25.7 ms).
ECG Live Monitor Screenshot
Telemetry Dashboard: Oscilloscope visualization with real-time waveform trace and autonomic state readouts.
ECG Signal Plot
Pan-Tompkins DSP Output: Filtered voltage trace demonstrating sharp R-peak amplification and baseline suppression.

Hardware Traps I Had to Solve

Building physical circuits revealed tricky problems you never see when analyzing clean CSV files:

1. Wall Outlet Hum (50 Hz Noise): When the laptop was plugged into a wall charger, electrical buzzing from the outlet flooded the heart signal with massive waves. Powering the system on battery completely eliminated this noise.
2. Motion Glitches: Whenever I moved my arm, the sticky pads tugged on the skin, creating temporary signal jumps that fooled basic peak counters. Keeping still during tests and using firm gel pads kept the trace steady.

What I Learned: Clean Hardware Beats Fancy AI

Your algorithm is only as good as your raw sensor data. If your physical circuit is clean, detecting heartbeats is simple and over 98% accurate. But if your sensor is noisy, even the most complex AI neural networks will get confused and hallucinate false beats.

How This Led to Phase 03

Transition to Phase 03: Long-Term Self-Monitoring & HRV Discovery

With a reliable, self-built acquisition rig in place, I was able to record my own physiology across weeks. This unlocked the ability to observe how heart rate variability shifts across real-life emotional extremes, illness, and cognitive work.

Explore Phase 03 Case Study

Technical Verification Specs

Metric Value Validation Method
R-Peak Timing Jitter < 2.4 ms Benchmarked against synthetic ECG generator
ADC Effective Resolution 15.2 Bits ADS1115 oversampled differential mode
GUI Refresh Rate 30 FPS PyQtGraph hardware-accelerated OpenGL viewport
Serial Baud Rate 115,200 bps Binary float protocol over USB-UART