Long-Term Self-Monitoring & HRV Discovery
I wore my self-built heart monitor over several weeks during normal daily life—working, coding, exercising, and resting. I discovered why one-size-fits-all health numbers fail: your personal baseline changes by up to 25 beats per minute depending on sleep and time of day. An algorithm must learn your personal baseline to be accurate.
The Problem: 3-Minute Lab Tests Miss Real Life
Most scientific studies only track people for 3 minutes in a quiet lab. But a 3-minute snapshot completely misses how your body changes from morning to night as you tire out or recover.
Using my custom test rig, I recorded my own heartbeats for weeks during real daily life: deep programming blocks, reading, stressful moments, workouts, and evening rest.
What was I trying to understand?
Can everyday heart rate variability accurately tell the difference between mental focus, physical exhaustion, and emotions—or do natural daily changes overwhelm the signal?
Tracking Protocol Specifications
| Domain | Protocol Details | Context |
|---|---|---|
| Acquisition Hardware | Custom AD8232 + ESP32 System | Lead-II chest configuration with wet gel electrodes |
| Duration | Multi-week continuous logging sessions | Covering mornings, intense work blocks, and evening rest |
| Subjective Annotation | Synchronized timestamped event logs | Self-recorded emotional tags, focus levels, and error occurrences |
| Reference Alignment | Cross-verified against DREAMER ECG | Benchmarked against 7 discrete emotion clusters from literature |
HRV Feature Extraction & Analysis
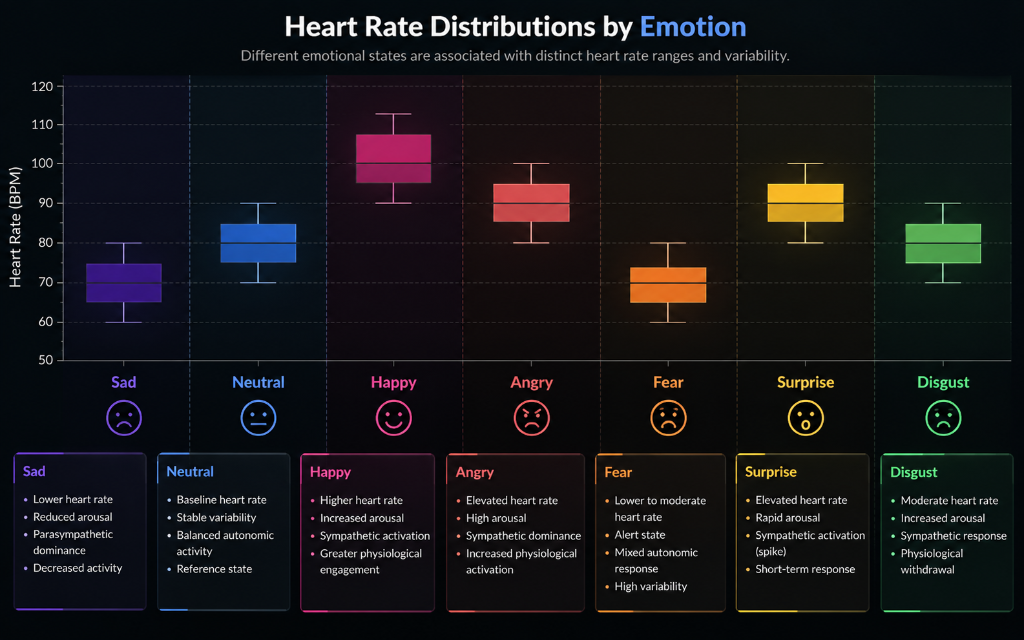
Heart Rate Zones Across Discrete Emotional States
Cross-analyzing physiological recordings revealed distinct autonomic clusters. High-arousal states (Happy ~100 bpm, Anger & Surprise ~90 bpm) demonstrated marked sympathetic elevation compared to low-arousal states (Sad ~70 bpm, Fear ~70 bpm), providing biological boundaries despite subjective label noise.
What Failed: The Collapse of Fixed Thresholds
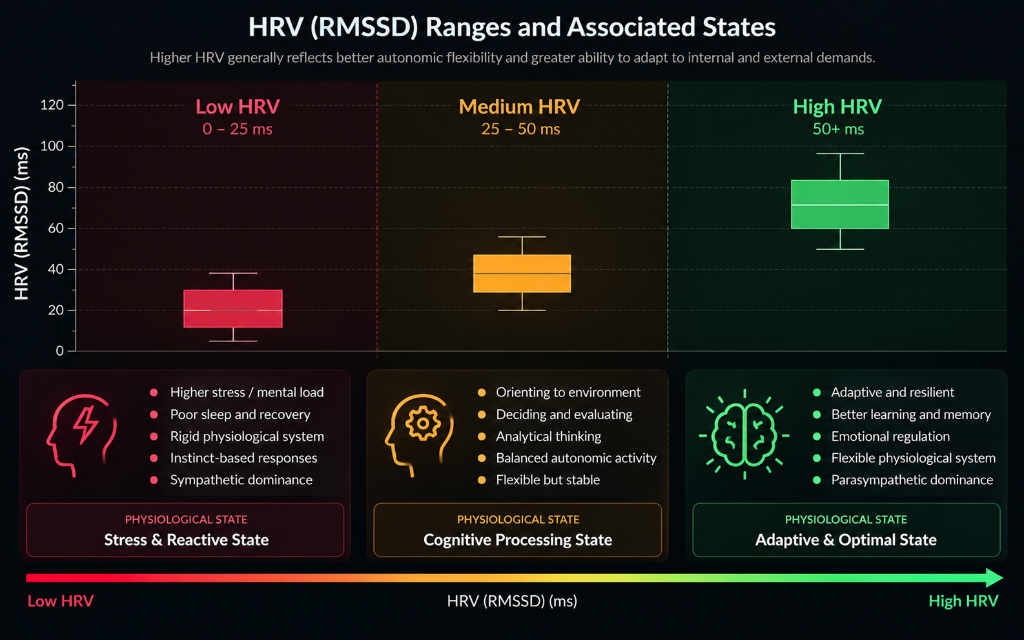
The primary algorithmic failure was attempting to use static, absolute HRV thresholds (e.g., "RMSSD < 20 ms = High Stress").
What I Learned: Relative Deviation Over Absolute Values
Physiological interpretation is fundamentally relative. A drop of 10 ms in RMSSD is meaningful only when compared against the individual's rolling 7-day circadian baseline. Furthermore, mental task execution consistently produced transient cardiac deceleration upon cognitive intake—pointing toward evoked cardiac dynamics during working memory.
What This Investigation Does NOT Prove
- N=1 single-subject tracking cannot establish population-level statistical generalizability on its own.
- Confounders like caffeine consumption and unmeasured ambient temperature introduce uncontrolled autonomic variance.
- Requires rigorous multi-participant psychophysiology validation in a formal laboratory experiment.
How This Led to Phase 04
Data Metrics Summary
| State Category | Median HR (BPM) | Autonomic Modulation |
|---|---|---|
| High Arousal (Happy / Excitement) | ~100 bpm | Sympathetic dominance, reduced vagal braking |
| High Arousal (Anger / Surprise) | ~90 bpm | Elevated heart rate, high LF/HF ratio |
| Low Arousal (Sad / Fear) | ~70 bpm | Parasympathetic predominance, restrained variance |
| Cognitive Focus (Code / Study) | ~74 bpm | Evoked deceleration upon task engagement |